

A data model is a graphical view of data created for analysis and design purposes. Data modeling includes designing data warehouse databases in detail, it follows principles and patterns established in Architecture for Data Warehousing and Business Intelligence.
If you need to understand this subject from the beginning check the article, Data Modeling Basics to learn key terms and concepts.
Data warehouse modeling includes:
Areas that require specialized patterns are:
Data modeling involves visualizing data through use of graphical tools, so you will want to obtain a data modeling software package or use graphical capabilities in existing software. See the Data Management Center Data Modeling Directory for a list of data modeling tools and other resources.
We have used open source software to develop examples for this article so that readers will able to learn on their own without licensing fees. Data models have been developed using DBDesigner4 from FabForce.Net. The target database is MySQL from Oracle Corporation.
It is best to organize data to best meet the needs of its users. Business intelligence commonly performs analytic operations on data such as:
The "Dimensional Data Model" otherwise known as the "Star Schema" was developed by Ralph Kimball in the 1980s to support these business needs. This approach has stood the test of time and is the recommended way to organize data for business query and analysis.
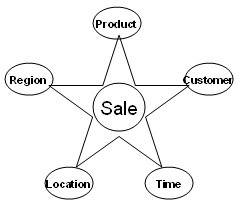
The two major table types of the Star Schema are the Fact and the Dimension. The Fact contains quantitative measurements while the Dimension contains classification information. Each Fact is surrounded by the Dimensions that provide context to it, given the appearance of a star.

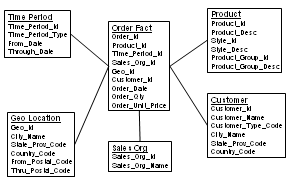
The Order Fact with dimensions is a classic example. In this case the Order Fact measurers order quantity and currency amount. Dimensions of Calendar Date, Product, Customer, Geo Location and Sales Organization put the Order Fact into context.

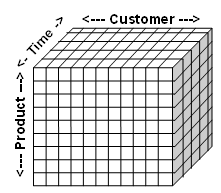
This star schema supports looking orders like a cube, enabling slicing and dicing by customer, time and product.

Surrogate keys, typical stored as integers, improve efficiency and increase performance. Joins between facts and dimensions are faster with integers. Indexes on integers are compact and provide rapid access.
Facts contain quantitative measurements. They focus on the answering the questions: how much and how many.
The grain is a determinant of the level of detail of the data mart fact. A fact can be fine grained and represent a single event or transaction or it can be course grained and aggregate measurements over a period of time.
Dimensions enable business intelligence users to analyze data using simple queries. They focus on questions of: who, when, where and what. Typical dimensions include:
The primary key of a dimension should a surrogate key and is typically an integer. This primary key is then related to facts to put the facts into context. Much of the data in a dimension is descriptive and stored character format. It often contains both code and expanded values such as territory_code and territory_name to simplify and speed up query.
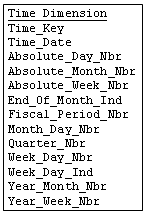
Time Dimensions are an important part of almost every dimensional model. We recommend that
you establish Time Dimension tables rather hard coded date logic.
Use the finest grain - probably daily and account for days, weeks, quarters, seasons, holidays, etc.

Dimensions are directly related to facts to enable simple and rapid query. The snowflake is an extension to a dimension intended to reduce storage and duplication. It has the undesirable side effect of complicating and slowing queries.
The bridge table supports a many to many relationship between facts and dimensions. For example, a bridge table could show the percentage commission split between multiple sales reps (dimension) and a sale (fact).
At times, dimension data must change and that must be handled in the data mart. Ralph Kimball has identified the following slowly changing dimension (SCD) types that are widely recognized in data mart design:
| SCD Type 1 |
Data is overwritten and prior data is not retained. |
| SCD Type 2 | A new row with the changed data. |
| SCD Type 3 |
Update attributes with in the dimension row. For example, we could maintain both current customer status code and prior customer status code. |
Infogoal.com is organized to help you gain mastery.
Examples may be simplified to facilitate learning.
Content is reviewed for errors but is not warranted to be 100% correct.
In order to use this site, you must read and agree to the
terms of use, privacy policy and cookie policy.
Copyright 2006-2020 by Infogoal, LLC. All Rights Reserved.
