

Certain analytics problems rely heavily on the relationships between people or things which is not effectively supported by relational databases like Oracle and SQL Server. Social media sites like LinkedIn and Facebook need to keep track of multi-level relationships between hundreds of millions of people to support communities. Financial services organizations like CapitalOne and Visa need to track relationships between large numbers of people, money flows and behaviors to detect potential fraud. Enterprise are also form networks held together by relationships. Retailers want to recommend products or services. Project managers want to plan projects which consist of a network of tasks. There are many additional challenges associated with networks or relationships. The answer to the database part of this challenge is the Graph Database.

Graph Database Management Systems are a type of DataBase Management System (DBMS) based on nodes, edes and properties which are the key concepts of graph data representation. In the graph model, nodes represent entities and edges represent relationships between entities. Graph DBMS excel when solving problems associated with data heavily structured by relationships such as fraud analytics and social media influence analysis. Graph DBMS enables use of graph algorithms executed in a more efficient manner than relational databases like Oracle and SQL Server
These concepts and terms are fundamental to graph theory:
Multiple vendors provide Graph DBMS Software. DB-Engines publishes a ranked list of graph DBMS. The top five in that list as of June 9, 2020 are:
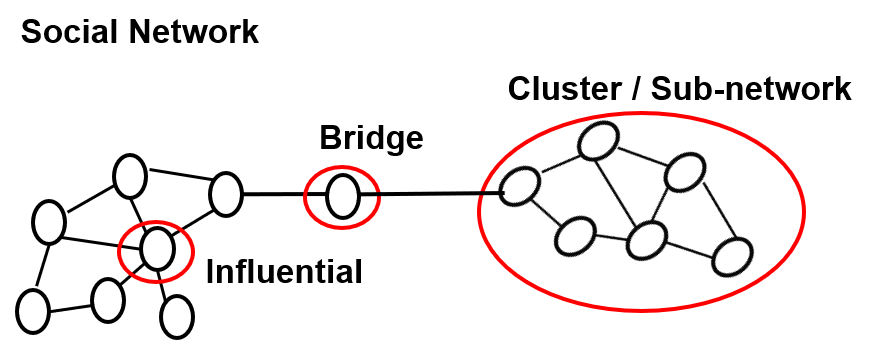
Both providers and those who analyze social media have agendas that can be addressed by graph concepts and graph databases. Social media providers seek to serve members with information like: potential contacts to add to contacts list; number of people known in common; number of people in network; list of contacts at level 1, 2, or 3; or recommendation - members who like X also like Y. Social media analyzers want to use social media to advance their agendas. They may want to: identify influencers, find trends, or gage customer sentiment. Graph databases and concepts can serve both social media providers and analyzers.

Add these graph database social network terms to your vocabulary:
Sometimes it feels like we are being assaulted by bad actors. Companies and individuals seek to address challenges like: credit card fraud, money laundering, identity theft, insurance claims fraud and fraudulent product orders. Graph databases and concepts can help.
Graphs can include information like: people, claims, transactions, products, stores, credit cards, geographic location, postal addresses, email addresses and electronic addresses. Rapidly growing networks where people share the same postall address or electronic device can be a clue exposing fraud rings. Changes in behavior such as using a charge card in a geographic location not used is a red flag that a credit card has been stolen.
Check out these Graph Database links:
Infogoal.com is organized to help you gain mastery.
Examples may be simplified to facilitate learning.
Content is reviewed for errors but is not warranted to be 100% correct.
In order to use this site, you must read and agree to the
terms of use, privacy policy and cookie policy.
Copyright 2006-2020 by Infogoal, LLC. All Rights Reserved.
